Microsoft Excel 2010 - Analyzing Data
- Product ID
- sonieada_vod
- Training Time ?
- 45 to 50 minutes
- Language(s)
- English
- Video Format
- High Definition
- Required Plugins
- None
- Number of Lessons
- 6
- Quiz Questions
- 5
- Question Feedback
- Wrong Answer Remediation
- Lesson Bookmarking
- Downloadable Resources


Effective business planning begins with good data and continues with skillful analysis of numbers. The process of creating accurate financial forecasts can be grueling without strong knowledge of key tools. Microsoft Excel 2010 features a variety of tools to simplify your business analytics. Trend and scenario functions have been improved for MS Excel 2010 and new features like “Sparklines” have been added to display more data in a smaller visual space.
These features are only as powerful as the knowledge of the user. Analyzing Data will make your team of managers, accountants and planners proficient in using Excel to forecast and analyze data. In less than 20 minutes, an expert facilitator will review the associated menus and functions of these features. Video demonstration and a quiz will lead to stronger knowledge transfer and ensure your learners can implement their new skills on the job!
![]() This course is in the Video On Demand format, to read about Video On Demand features click here.
This course is in the Video On Demand format, to read about Video On Demand features click here.

- Install on any SCORM LMS
- Full-screen video presentation
- Print certificate and wallet card
- You have 30 days to complete the course
Microsoft Excel 2010 Users
- Analyzing Data
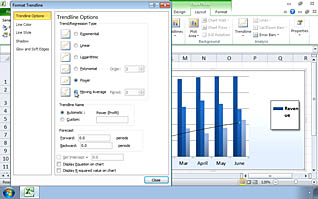
- Creating a Trendline
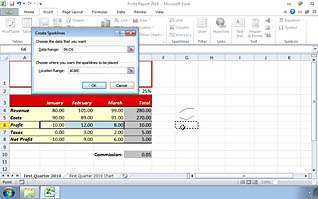
- Creating Sparklines
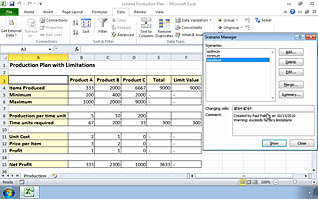
- Creating Scenarios
- Performing a What If Analysis Solve
- The Solver Parameters Dialog Box
© Mastery Technologies, Inc.


